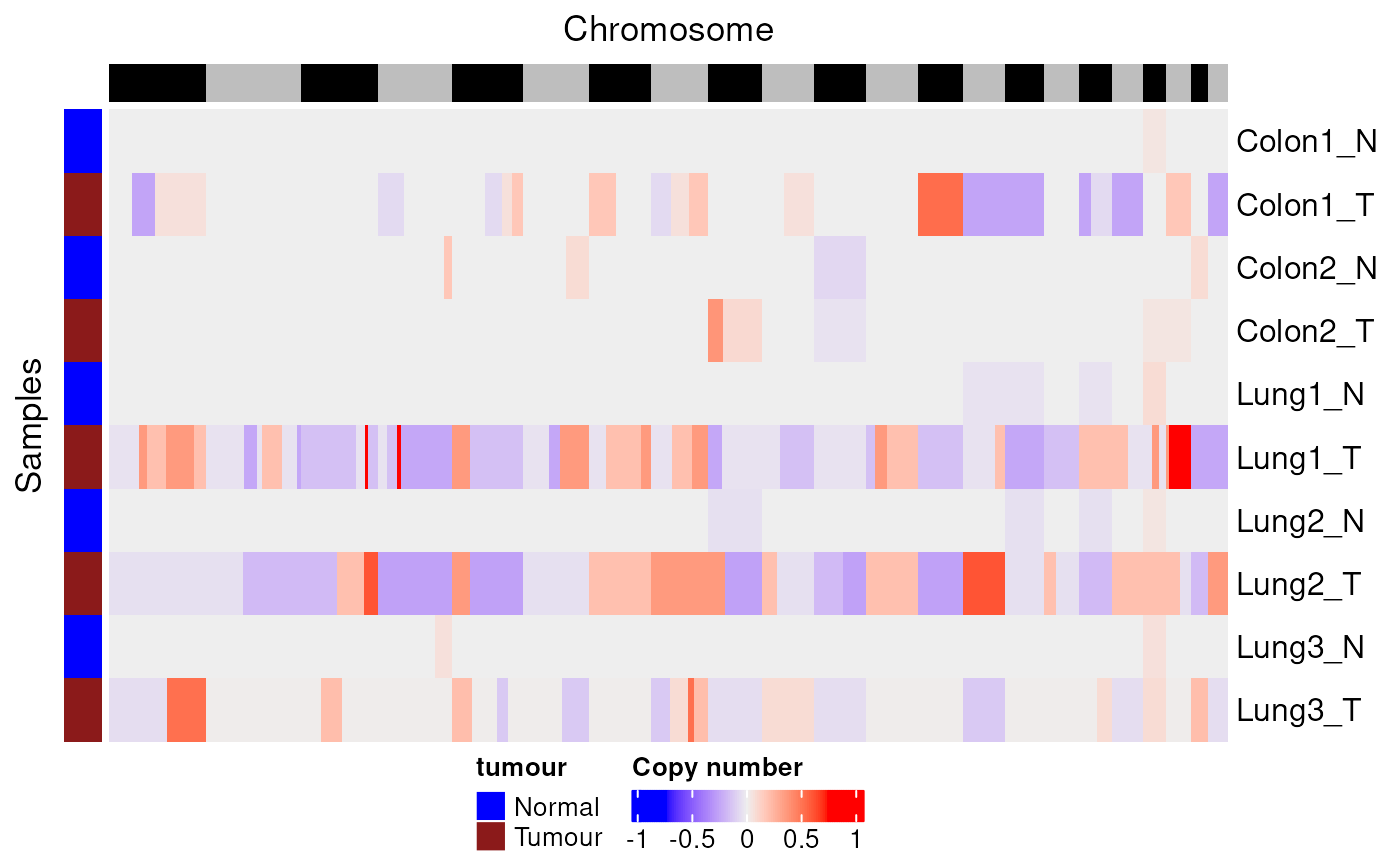
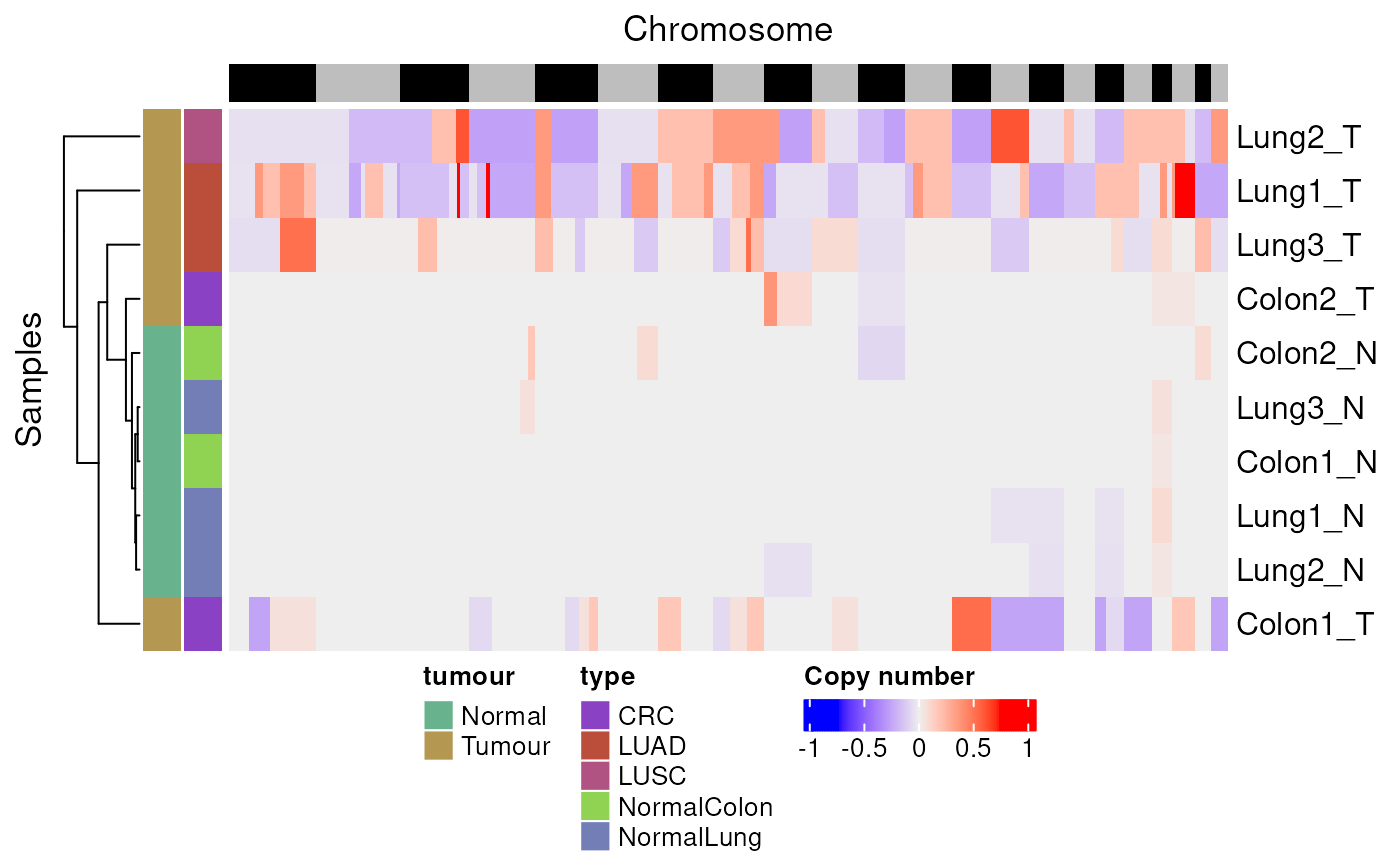
Plot per-window copy-number estimates stored in a qseaSet as a heatmap
using ComplexHeatmap. Each column is a sample; rows are genome windows.
plotCNVheatmap(
  qseaSet,
  sampleAnnotation = NULL,
  annotationColors = NA,
  clusterRows = TRUE
)
Arguments
- qseaSet
qseaSet. Input object containing per-window CNV tracks (e.g., created byaddHMMcopyCNV()orqsea::addCNV()).- sampleAnnotation
tidyselect specification,
character(), orNULL. Sample-table columns to display as column annotations (e.g.,c("tumour","type")or bare helperstumour, type). Default:NULL.- annotationColors
listorNA. Optional mapping of levels → colours to override auto palettes, e.g.list(tumour = c(Tumour = "firebrick4", Normal = "blue")). Default:NA.- clusterRows
logical(1). Cluster rows (windows) before plotting. Default:TRUE.
Value
Draws a heatmap on the active device and (invisibly) returns the underlying
ComplexHeatmap object for further composition with
draw.
Details
Assumes CNV values are available per window and sample. Rows are windows
(typically in genomic order if clusterRows = FALSE), columns are samples.
Sample annotations (and optional colours) are added when sampleAnnotation
and annotationColors are provided.
See also
addHMMcopyCNV(), runHMMcopy(),
Heatmap,
qsea::addCNV()
Other CNV:
addHMMcopyCNV(),
removeCNV(),
runHMMCopy()
Examples
data(exampleTumourNormal, package = "mesa")
# Basic CNV heatmap with sample annotations
exampleTumourNormal %>%
plotCNVheatmap(sampleAnnotation = c(tumour, type))
 # Custom annotation colours; disable row clustering
exampleTumourNormal %>%
plotCNVheatmap(
sampleAnnotation = tumour,
annotationColors = list(
tumour = c(Tumour = "firebrick4", Normal = "blue")
),
clusterRows = FALSE
)
# Custom annotation colours; disable row clustering
exampleTumourNormal %>%
plotCNVheatmap(
sampleAnnotation = tumour,
annotationColors = list(
tumour = c(Tumour = "firebrick4", Normal = "blue")
),
clusterRows = FALSE
)