Plot sample signal over a set of regions as a heatmap using
ComplexHeatmap.
Regions are selected by overlap with regionsToOverlap, values are taken
from
the qseaSet, and optional annotations from the sample/region metadata can
be added.
plotRegionsHeatmap(
  qseaSet,
  regionsToOverlap = NULL,
  normMethod = "beta",
  sampleAnnotation = NULL,
  windowAnnotation = NULL,
  annotationColors = NA,
  useGroupMeans = FALSE,
  clusterRows = FALSE,
  clusterCols = TRUE,
  minEnrichment = 3,
  maxScale = 5,
  clusterNum = NULL,
  clip = 1e+09,
  minDensity = 0,
  annotationPosition = "right",
  title = NULL,
  showSampleNames = NULL,
  clusterMethod = "ward.D2",
  ...
)
Arguments
- qseaSet
qseaSet. Input object containing windows and counts/betas.- regionsToOverlap
GRanges,data.frame(coercible toGRanges), orNULL. If provided, only windows overlapping these regions are plotted; otherwise all windows are considered. Default:NULL.- normMethod
character(1). Which measure to plot,"beta"or"nrpm". Default:"beta".- sampleAnnotation
character()orNULL. Names of columns from the sample table to display as column annotations (e.g.,c("tumour","tissue")). Default:NULL.- windowAnnotation
character()orNULL. Names of columns from region metadata (from theqseaSetregions orregionsToOverlap) to display as row annotations (e.g.,c("CpG_density")). Default:NULL.- annotationColors
listorNA. Optional named colour maps for annotations, e.g.list(tumour = c(Tumour = "firebrick4", Normal = "blue")). Default:NA.- useGroupMeans
logical(1). IfTRUE, average samples by thegroupcolumn in the sample table (combine replicates). Default:FALSE.- clusterRows
logical(1). Whether to cluster rows (windows). Default:FALSE.- clusterCols
logical(1). Whether to cluster columns (samples). Default:TRUE.- minEnrichment
numeric(1). For"beta", values with enrichment< minEnrichmentare set toNA. Default:3.- maxScale
numeric(1). Upper limit of the colour scale (used for"nrpm"; not applied to"beta"). Default:5.- clusterNum
integer(1)orNULL. If set, cut the column dendrogram into this many clusters and display cluster labels. Default:NULL.- clip
numeric(1). Cap values above this threshold before plotting (applies to"nrpm", ignored for"beta"). Default:1e9.- minDensity
numeric(1). MinimumCpG_densityrequired to keep a window. Default:0.- annotationPosition
character(1). Where to place column annotations (e.g.,"right"or"bottom"). Default:"right".- title
character(1)orNULL. Optional plot title. Default:NULL.- showSampleNames
logical(1)orNULL. IfNULL, names are shown when there are fewer than 50 samples; setTRUE/FALSEto force. Default:NULL.- clusterMethod
character(1). Clustering method for dendrograms (e.g.,"ward.D2"). Default:"ward.D2".- ...
Additional arguments forwarded to ComplexHeatmap constructors.
Value
Draws a heatmap on the active device and (invisibly) returns the underlying
ComplexHeatmap object (e.g., a Heatmap/HeatmapList) for further
composition with
draw.
Details
Windows are filtered by overlap (if regionsToOverlap is given) and by
minDensity.
For "beta", low-enrichment values are set to NA using minEnrichment.
For "nrpm",
clip and maxScale help stabilise colour scaling for outliers. If
useGroupMeans = TRUE,
samples are aggregated by group before plotting.
See also
Examples
data(exampleTumourNormal, package = "mesa")
# Compute regions (DMRs) to plot
DMRs <- exampleTumourNormal %>%
calculateDMRs(variable = "tumour", contrasts = "first")
#> Calculating the first possible contrast on the tumour column.
#> Generating table of nrpm values for 819 regions across 10 samples.
#> Fitting initial GLM on 309 windows, without using parallelisation.
#> Performing contrast Normal_vs_Tumour
#> Contrasts Complete
#> selecting regions from contrast Normal_vs_Tumour
#> selected 23/309 windows
#> adding test results from Normal_vs_Tumour
# Basic heatmap of beta values over DMRs
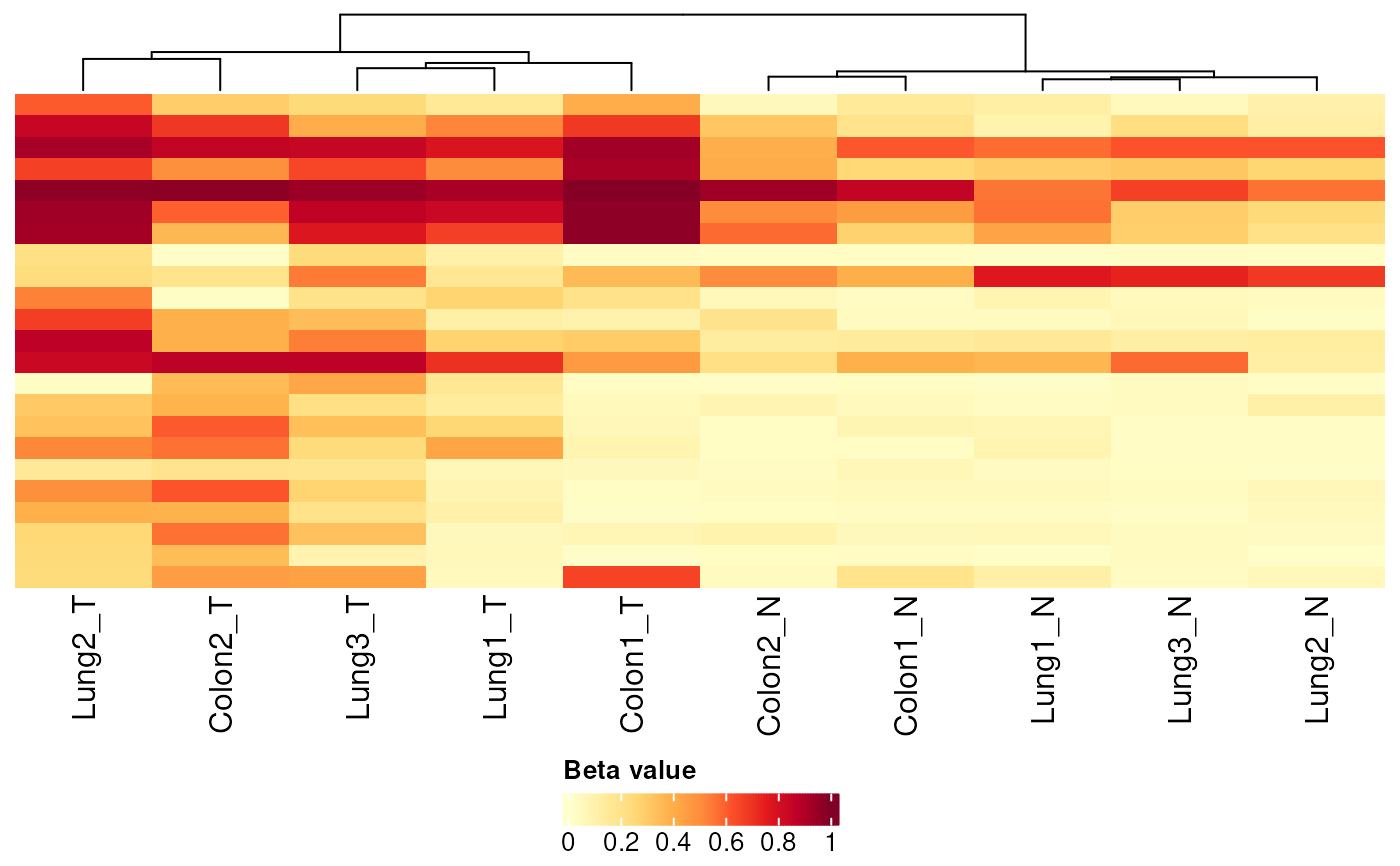
exampleTumourNormal %>% plotRegionsHeatmap(DMRs)
#> Generating table of beta values for 23 regions across 10 samples.
#> No empty columns to remove.
#> No empty rows to remove.
 # Cluster rows, add sample and window annotations
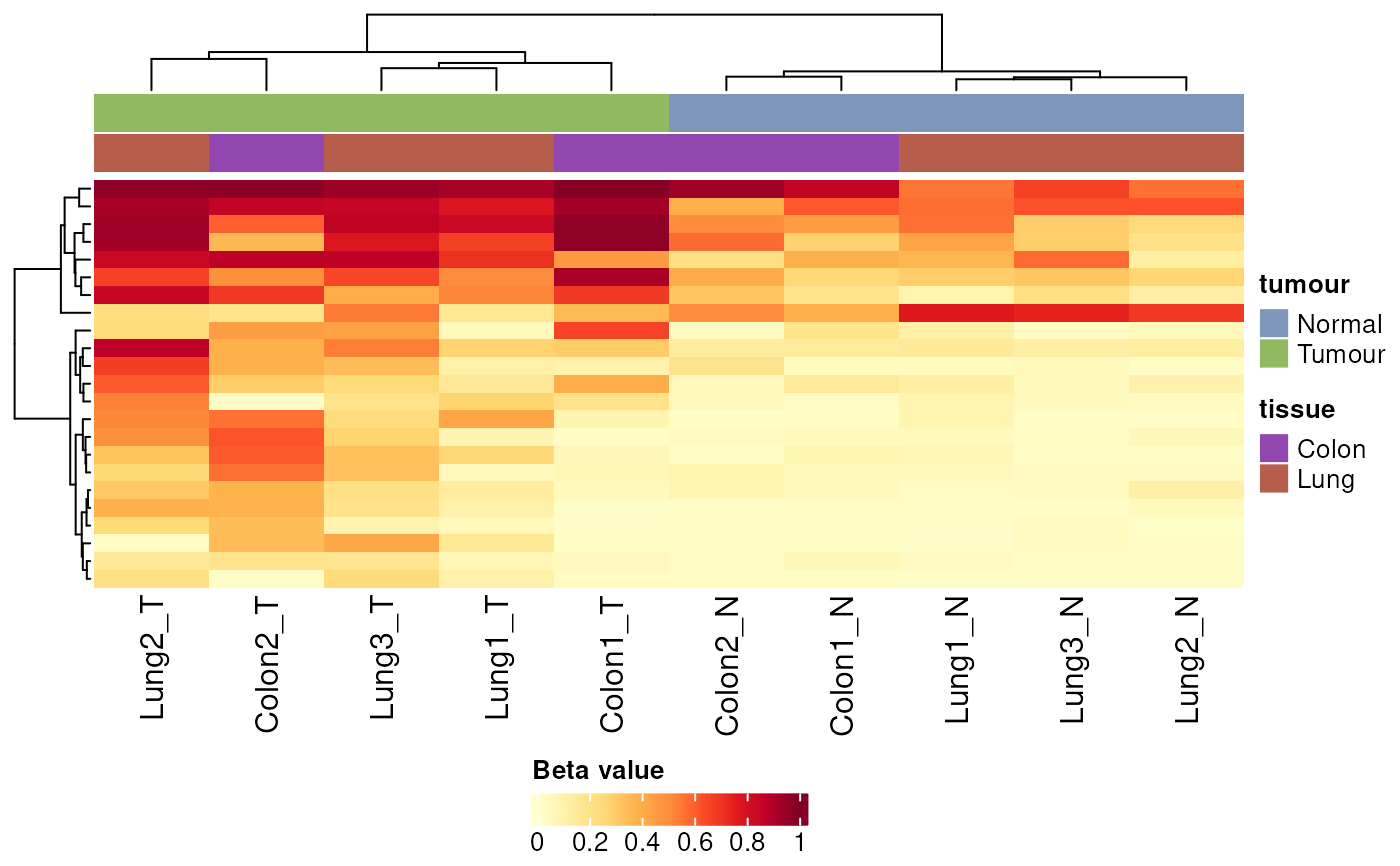
exampleTumourNormal %>%
plotRegionsHeatmap(DMRs,
clusterRows = TRUE,
sampleAnnotation = c(tumour, tissue))
#> Generating table of beta values for 23 regions across 10 samples.
#> No empty columns to remove.
#> No empty rows to remove.
# Cluster rows, add sample and window annotations
exampleTumourNormal %>%
plotRegionsHeatmap(DMRs,
clusterRows = TRUE,
sampleAnnotation = c(tumour, tissue))
#> Generating table of beta values for 23 regions across 10 samples.
#> No empty columns to remove.
#> No empty rows to remove.
 # Group means, 2 column clusters, and custom annotation colours
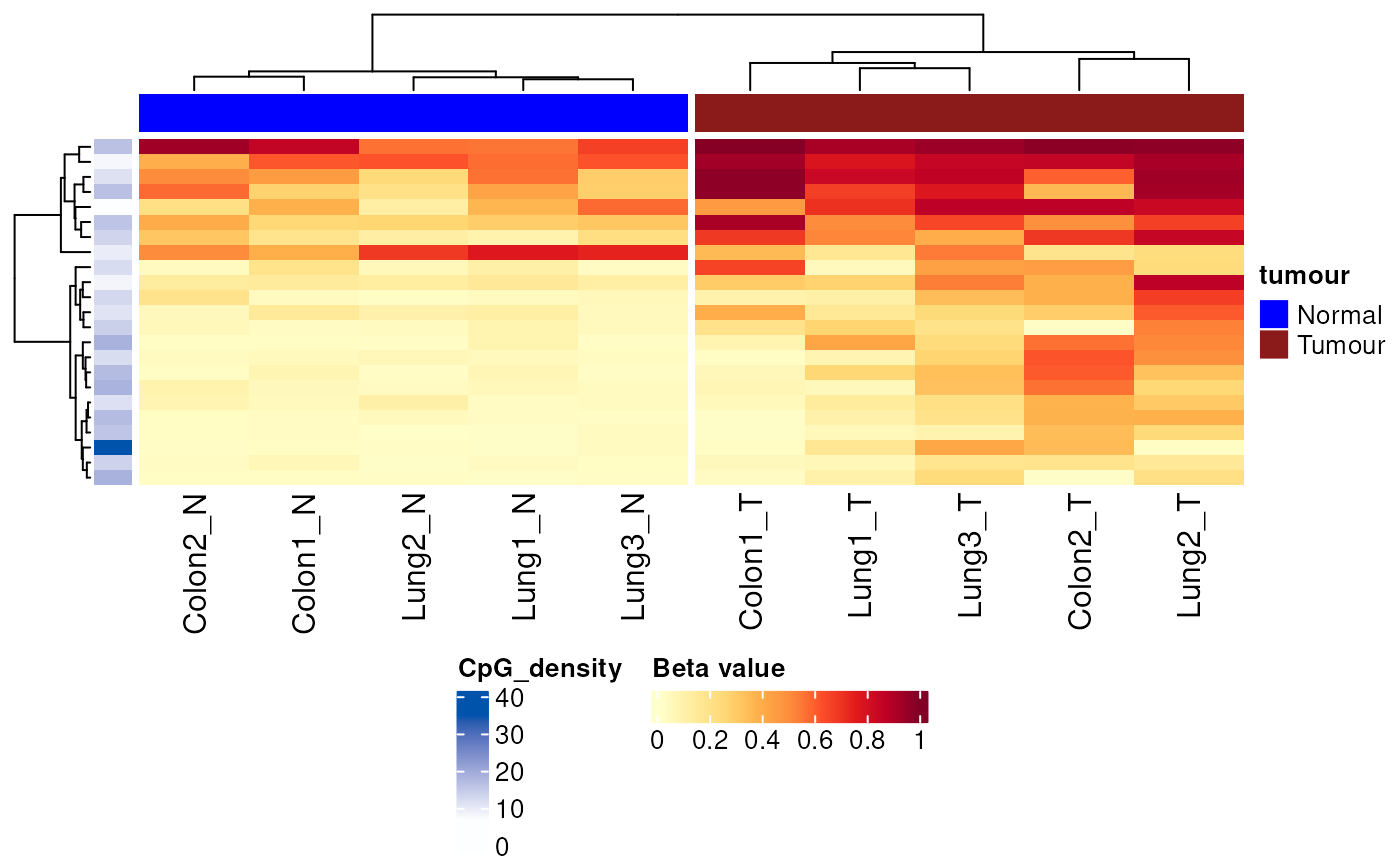
exampleTumourNormal %>%
plotRegionsHeatmap(regionsToOverlap = DMRs,
clusterRows = TRUE,
clusterNum = 2,
sampleAnnotation = tumour,
windowAnnotation = CpG_density,
annotationColors = list(
tumour = c("Tumour" = "firebrick4", "Normal" = "blue")
)
)
#> Generating table of beta values for 23 regions across 10 samples.
#> No empty columns to remove.
#> No empty rows to remove.
# Group means, 2 column clusters, and custom annotation colours
exampleTumourNormal %>%
plotRegionsHeatmap(regionsToOverlap = DMRs,
clusterRows = TRUE,
clusterNum = 2,
sampleAnnotation = tumour,
windowAnnotation = CpG_density,
annotationColors = list(
tumour = c("Tumour" = "firebrick4", "Normal" = "blue")
)
)
#> Generating table of beta values for 23 regions across 10 samples.
#> No empty columns to remove.
#> No empty rows to remove.