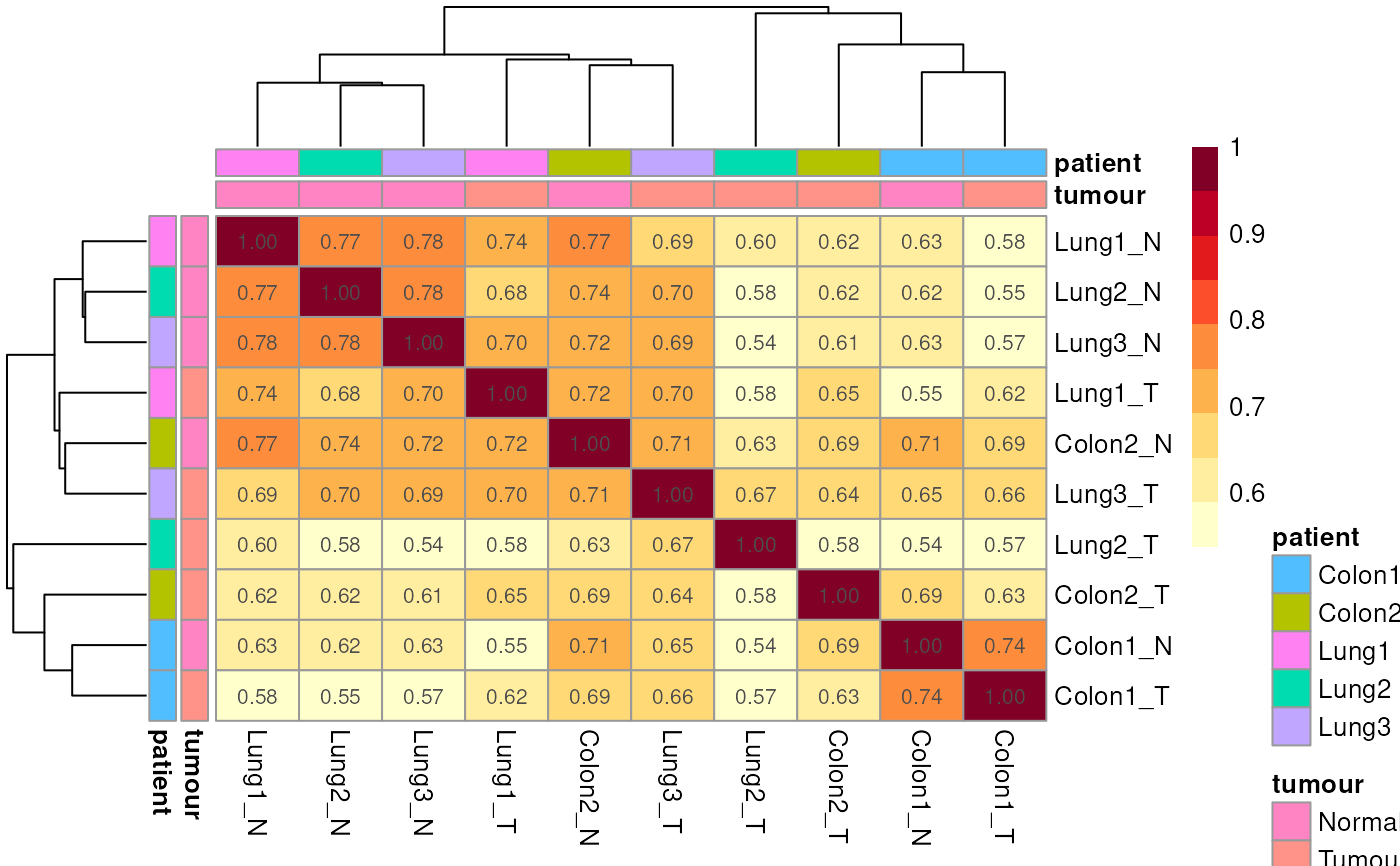
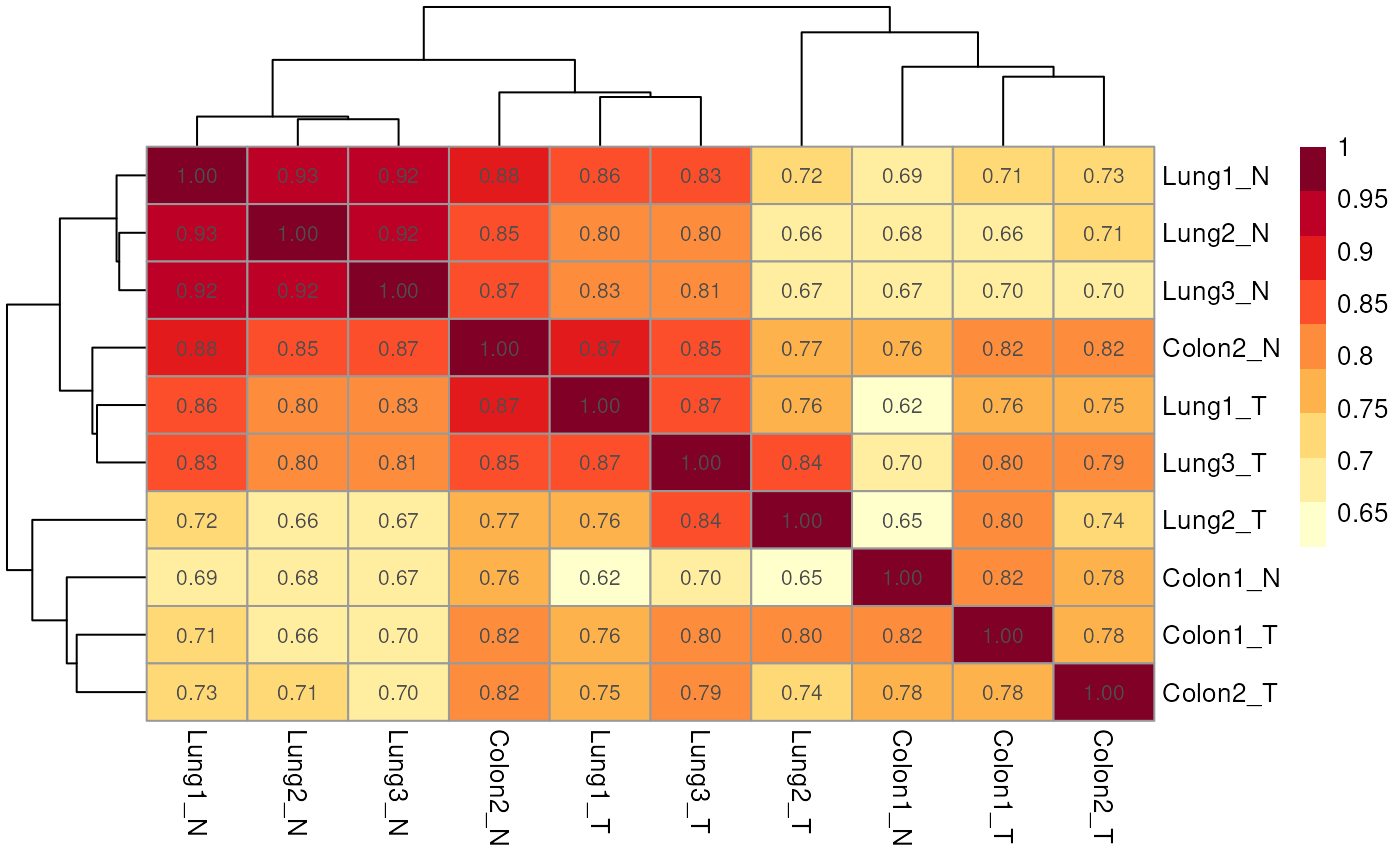
Compute and plot the correlation matrix across samples (or group means) using the selected normalisation measure and optional region filters.
plotCorrelationMatrix(
  qseaSet,
  regionsToOverlap = NULL,
  useGroupMeans = FALSE,
  sampleAnnotation = NULL,
  normMethod = "nrpm",
  minEnrichment = 3,
  annotationColors = NA,
  minDensity = 0,
  ...
)
Arguments
- qseaSet
qseaSet. Input object containing windows and signal (beta or nrpm).- regionsToOverlap
GRanges,data.frame(coercible toGRanges), orNULL. If provided, restrict computation to windows overlapping these regions; otherwise use all windows. Default:NULL.- useGroupMeans
logical(1). IfTRUE, average replicates by thegroupcolumn and compute correlations on group means; ifFALSE, use individual samples. Default:FALSE.- sampleAnnotation
tidyselect specification or
character()orNULL. Columns from the sample table to display as annotations on the heatmap (e.g.,c("tumour","patient")or bare helperstumour, patient). Default:NULL.- normMethod
character(1). Measure to correlate. One of"nrpm"or"beta". Default:"nrpm".- minEnrichment
numeric(1). For"beta", values with enrichment< minEnrichmentare set toNAbefore correlation. Default:3.- annotationColors
listorNA. Optional named colour maps for annotations (passed to pheatmap), e.g.list(tumour = c(Tumour = "firebrick4", Normal = "blue")). Default:NA.- minDensity
numeric(1). MinimumCpG_densityrequired to keep a window. Default:0.- ...
Additional arguments forwarded to
pheatmap::pheatmap().
Value
A pheatmap::pheatmap object.
Details
Windows are optionally restricted by regionsToOverlap and filtered by
minDensity.
Correlations are computed on the chosen normMethod after any group
averaging.
For "beta", entries below minEnrichment are set to NA to down-weight
low-enrichment windows.
Examples
data(exampleTumourNormal, package = "mesa")
# By default uses NRPM
exampleTumourNormal %>% plotCorrelationMatrix()
#> Generating table of nrpm values for 819 regions across 10 samples.
#> No empty columns to remove.
#> No empty rows to remove.
 # Using beta values and adding sample annotations
exampleTumourNormal %>%
plotCorrelationMatrix(normMethod = "beta",
sampleAnnotation = c(tumour, patient))
#> Generating table of beta values for 819 regions across 10 samples.
#> No empty columns to remove.
#> No empty rows to remove.
# Using beta values and adding sample annotations
exampleTumourNormal %>%
plotCorrelationMatrix(normMethod = "beta",
sampleAnnotation = c(tumour, patient))
#> Generating table of beta values for 819 regions across 10 samples.
#> No empty columns to remove.
#> No empty rows to remove.