Plot sample signal over windows spanning a gene (± flanks) as a heatmap using ComplexHeatmap. The gene can be given as a HGNC symbol or Ensembl ID.
Source:R/plotting.R
plotGeneHeatmap.RdPlot sample signal over windows spanning a gene (± flanks) as a heatmap using ComplexHeatmap. The gene can be given as a HGNC symbol or Ensembl ID.
plotGeneHeatmap(
  qseaSet,
  gene,
  normMethod = "beta",
  useGroupMeans = FALSE,
  sampleAnnotation = NULL,
  minDensity = 0,
  minEnrichment = 3,
  maxScale = 1,
  clusterNum = NULL,
  annotationColors = NA,
  upstreamDist = 3000,
  scaleRows = FALSE,
  clusterCols = TRUE,
  mart = NULL,
  showSampleNames = NULL,
  downstreamDist = 1000,
  idType = NULL,
  ...
)
Arguments
- qseaSet
qseaSet. Input object containing windows and counts/betas.- gene
character(1). Gene identifier to plot (HGNC symbol like"HOXA9"or Ensembl ID like"ENSG000...").- normMethod
character(1). Which measure to plot. One of"beta"or"nrpm". Default:"beta".- useGroupMeans
logical(1). IfTRUE, average samples by thegroupcolumn in the sample table (combine replicates). Default:FALSE.- sampleAnnotation
tidyselect specification or
character()orNULL. Columns from the sample table to display as column annotations (e.g.,c("tumour","tissue")or bare helperstumour, tissue). Default:NULL.- minDensity
numeric(1). MinimumCpG_densityrequired to keep a window. Default:0.- minEnrichment
numeric(1). For"beta", values with enrichment< minEnrichmentare set toNA. Default:3.- maxScale
numeric(1). Upper limit of the colour scale (used for"nrpm"; not applied to"beta"). Default:1.- clusterNum
integer(1)orNULL. If set, cut the column dendrogram into this many clusters and display cluster labels. Default:NULL.- annotationColors
listorNA. Optional named colour maps for annotations, e.g.list(tumour = c(Tumour = "firebrick4", Normal = "blue")). Default:NA.- upstreamDist
integer(1). Number of base pairs upstream of the gene to include. Default:3000.- scaleRows
logical(1). Whether to z-score scale rows (windows) before plotting. Default:FALSE.- clusterCols
logical(1). Whether to cluster columns (samples). Default:TRUE.- mart
biomaRt::MartorNULL. Ensembl mart used to resolve gene coordinates. IfNULL, attempts to use a mart stored on theqseaSet(seesetMart()); otherwise falls back to a default for GRCh38/hg38 or hg19. Default:NULL.- showSampleNames
logical(1)orNULL. IfNULL, names are shown when there are fewer than 50 samples; setTRUE/FALSEto force. Default:NULL.- downstreamDist
integer(1). Number of base pairs downstream of the gene to include. Default:1000.- idType
character(1)orNULL. Column in the mart to matchgeneagainst (needed for non-human/mouse setups). Default:NULL.- ...
Additional arguments forwarded to ComplexHeatmap constructors.
Value
Draws a heatmap on the active device and (invisibly) returns the underlying
ComplexHeatmap object (e.g., a Heatmap/HeatmapList) for further
composition
with draw.
Details
The function resolves the gene to genomic coordinates (using mart, or a
mart
stored on the object, or a built-in default for human builds), expands the
interval by upstreamDist/downstreamDist, filters windows by overlap and
minDensity, then draws a heatmap of "beta" or "nrpm". For "beta",
values
below minEnrichment are set to NA. If useGroupMeans = TRUE, samples are
aggregated by group prior to plotting. Column annotations can be added via
sampleAnnotation; colours can be customized via annotationColors.
See also
Examples
# \donttest{
data(exampleTumourNormal, package = "mesa")
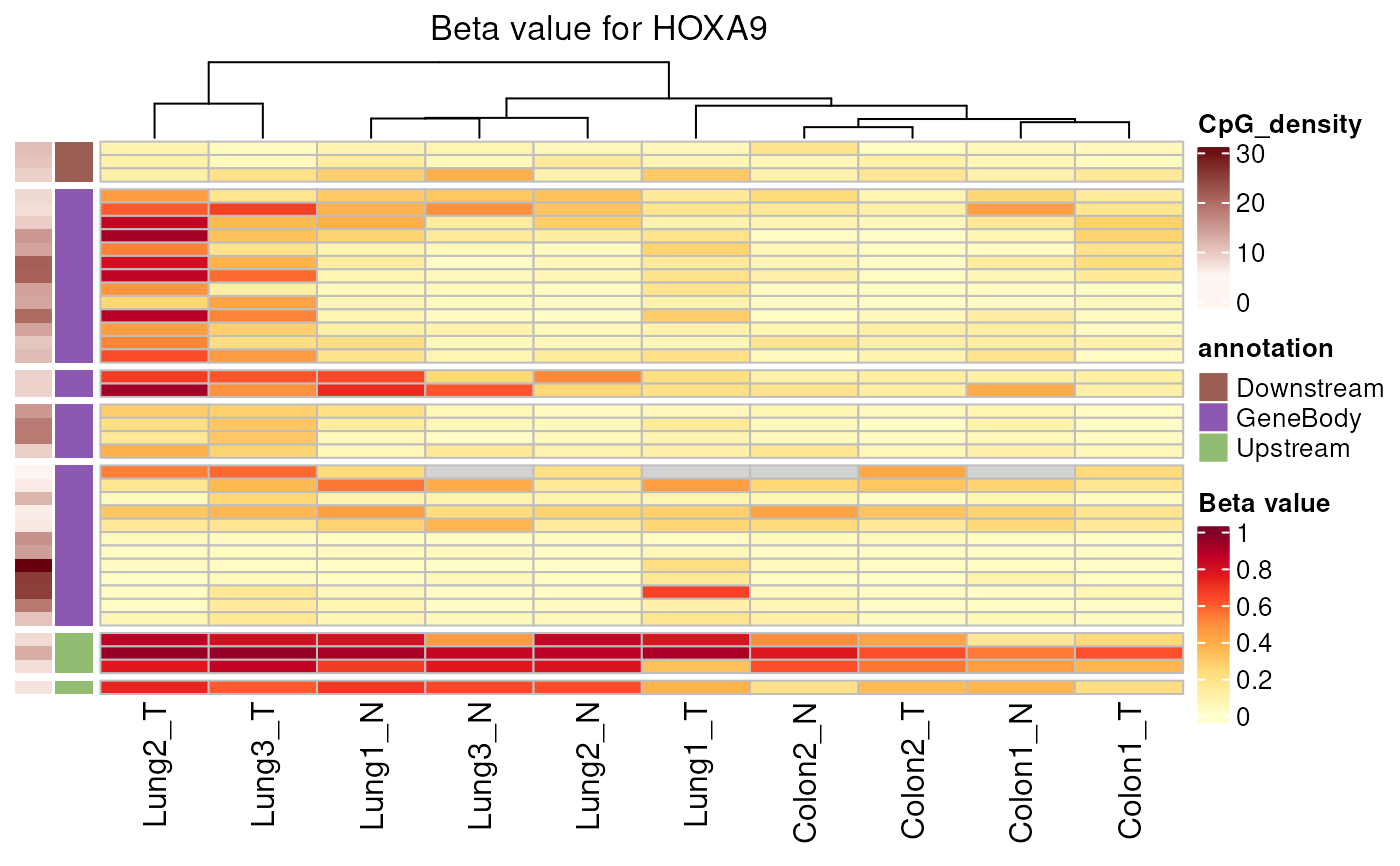
# Basic gene heatmap (beta) with defaults
tryCatch(
exampleTumourNormal %>% plotGeneHeatmap("HOXA9"),
error = function(e) message("Ensembl unavailable: ", conditionMessage(e))
)
#> Found HOXA9 on chromosome 7, 27162438 - 27175180
#> Generating table of beta values for 38 regions across 10 samples.
#> No empty columns to remove.
 # Add sample annotations (tidyselect bare names) and cluster columns into
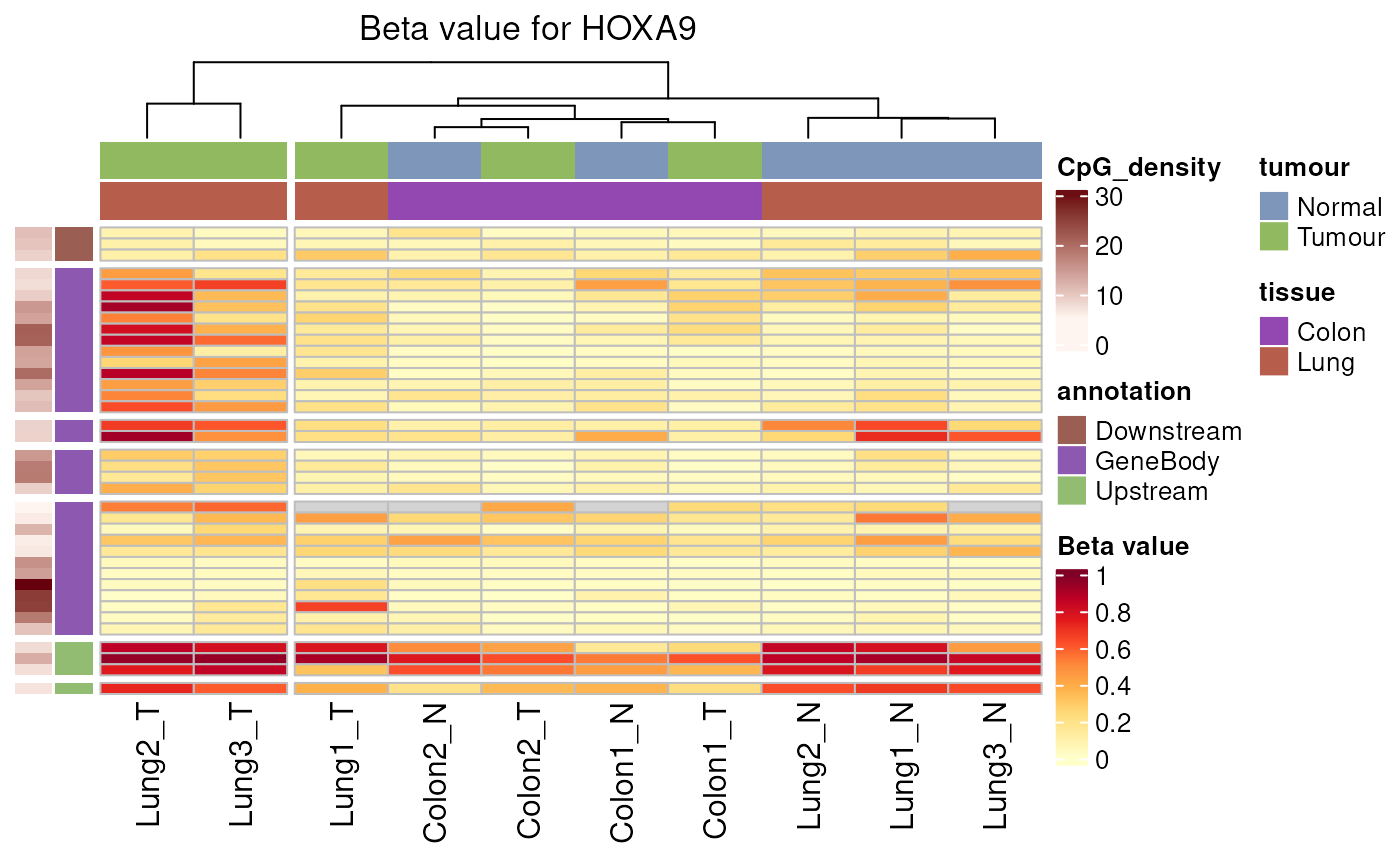
# 2 groups
tryCatch(
exampleTumourNormal %>%
plotGeneHeatmap("HOXA9",
sampleAnnotation = c(tumour, tissue),
clusterNum = 2),
error = function(e) message("Ensembl unavailable: ", conditionMessage(e))
)
#> Found HOXA9 on chromosome 7, 27162438 - 27175180
#> Generating table of beta values for 38 regions across 10 samples.
#> No empty columns to remove.
# Add sample annotations (tidyselect bare names) and cluster columns into
# 2 groups
tryCatch(
exampleTumourNormal %>%
plotGeneHeatmap("HOXA9",
sampleAnnotation = c(tumour, tissue),
clusterNum = 2),
error = function(e) message("Ensembl unavailable: ", conditionMessage(e))
)
#> Found HOXA9 on chromosome 7, 27162438 - 27175180
#> Generating table of beta values for 38 regions across 10 samples.
#> No empty columns to remove.
 # Custom colours and wider flanks
tryCatch(
exampleTumourNormal %>%
plotGeneHeatmap("HOXA9",
sampleAnnotation = tumour,
annotationColors = list(
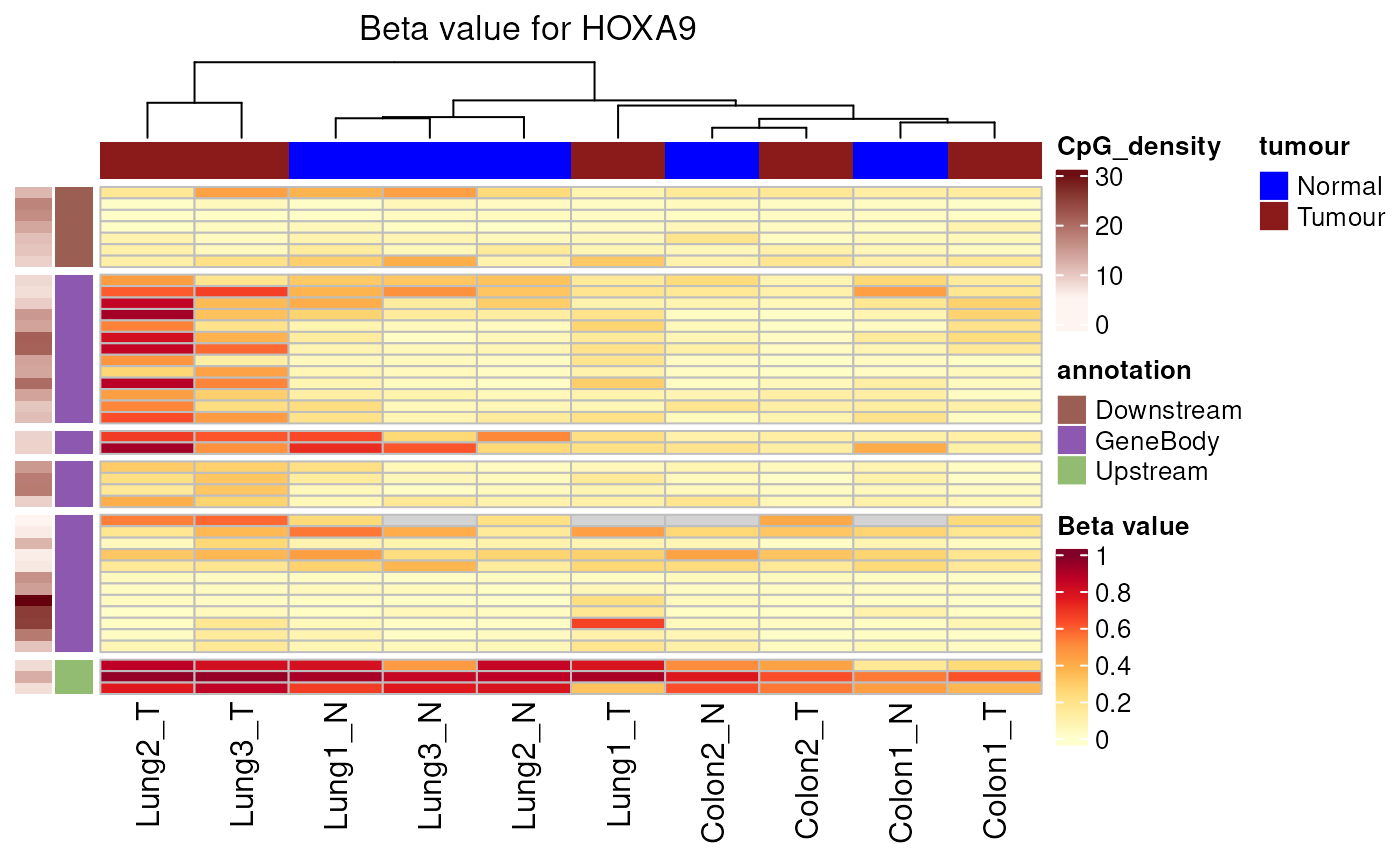
tumour = c(Tumour = "firebrick4", Normal = "blue")
),
upstreamDist = 1000,
downstreamDist = 2000),
error = function(e) message("Ensembl unavailable: ", conditionMessage(e))
)
#> Found HOXA9 on chromosome 7, 27162438 - 27175180
#> Generating table of beta values for 41 regions across 10 samples.
#> No empty columns to remove.
# Custom colours and wider flanks
tryCatch(
exampleTumourNormal %>%
plotGeneHeatmap("HOXA9",
sampleAnnotation = tumour,
annotationColors = list(
tumour = c(Tumour = "firebrick4", Normal = "blue")
),
upstreamDist = 1000,
downstreamDist = 2000),
error = function(e) message("Ensembl unavailable: ", conditionMessage(e))
)
#> Found HOXA9 on chromosome 7, 27162438 - 27175180
#> Generating table of beta values for 41 regions across 10 samples.
#> No empty columns to remove.
 # }
# }